Information providers have found several interesting ways of pictorially representing the investment objective. The US fund rating outfit Morningstar pioneered a visual style box for capturing a fund’s investment style. In India, some fund research agencies have tried to emulate this and picturise equity schemes in a 3x3 matrix along two parameters — investment style and capitalisation.
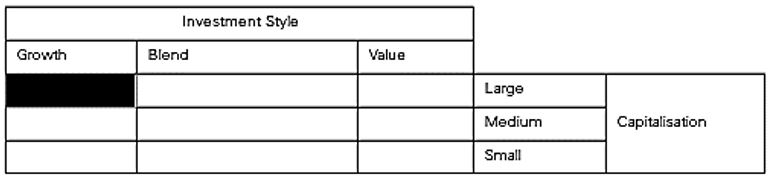
[Investment Styles and Capitalisation of Mutual Fund-1]
The classification between large, medium and small capitalisations was quite subjective until SEBI defined them.
Debt schemes are similarly picturised along two parameters — credit quality and interest rate sensitivity.
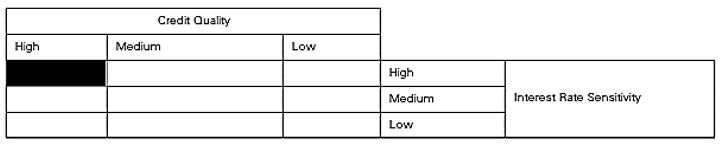
[Investment Styles and Capitalisation of Mutual Fund-2]
Every company can be strait-jacketed into a single investment style (growth, blended or value) and a single capitalization category (large, medium or small). However, some returns in a growth stock fund are also associated with returns in a value-investment index. Similarly, some returns in a mid-cap stock are also associated with returns in a large-cap index. In an investment style analysis, how does one factor such correlation of returns between asset classes?
Advanced investment style analysis comes in handy to address such problems. Style analyses go beyond the portfolio statement to the underlying asset return sensitivities. The following details of such an asset class factor model are extracted from William Sharpe’s paper on the subject.
William Sharpe used 12 asset classes for his analysis:
1. Bills:
- Cash equivalents with less than 3 months to maturity.
- Index: Salomon Brothers’ 90-day Treasury bill index.
2. Intermediate-term government bonds:
- Government bonds with less than 10 years to maturity.
- Index: Lehman Brothers’ Intermediate-term Government Bond Index.
3. Long-term government bonds:
- Government bonds with more than 10 years to maturity.
- Index. Lehman Brothers’ Long-term Government Bond Index.
4. Corporate bonds:
- Corporate bonds with ratings of at least Baa by Moody’s or BBB by Standard & Poor.
- Index. Lehman Brothers’ Corporate Bond Index.
5. Mortgage-related securities:
- Mortgage-backed and related securities.
- Index. Lehman Brothers’ Mortgage-Backed Securities Index.
6. Large-capitalization value stocks:
- Stocks in Standard and Poor’s 500-stock index with high book-to-price ratios.
- Index. Sharpe I BARRA Value Stock Index.
7. Large-capitalization growth stocks:
- Stocks in Standard and Poor’s 500-stock index with low book-to-price ratios.
- Index. Sharpe I BARRA Growth Stock Index.
8. Medium-capitalization stocks:
- Stocks in the top 80% of capitalization in the US equity universe after the exclusion of stocks in Standard and Poor’s 500 stock index.
- Index: Sharpe I BARRA Medium Capitalization Stock Index.
9. Small-Capitalization Stocks
- Stocks in the bottom 20% of capitalization in the U.S. equity universe after the exclusion of stocks in Standard and Poor's 500 stock index
- Index: Sharpe/BARRA Small Capitalization Stock Index
10. Non-U.S. Bonds
- Bonds outside the U.S. and Canada
- Index: Salomon Brothers' Non-U.S. Government Bond Index
11. European Stocks.
- European and non-Japanese Pacific Basin stocks
- Index: FTA Euro-Pacific Ex Japan Index
12. Japanese Stocks.
- Japanese Stocks
- Index: FTA Japan Index
A quadratic programming exercise was carried out, for the returns in various schemes and the underlying asset classes, based on monthly returns for the time period January 1985 to December 1989. The following are the results of the analysis, as applied to a leading US fund.
During the period ended December 1989, only 2.7% of the monthly variation in XYZ Fund returns could be attributed to selection of securities within asset classes. Over 97.3% of the monthly variation in XYZ Fund returns could be attributed to the concurrent return on a passive portfolio with the style shown below :
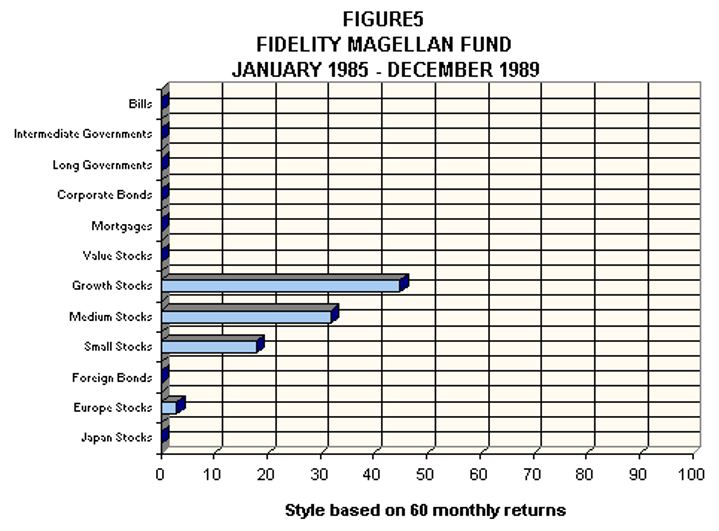
[Style based on 60 monthly returns]
This 97.3% was basically the R-squared value that came out of the quadratic programming exercise. Sharpe used R-squared as an indicator of returns that came out of Style (asset class); the balance, namely 1 minus R-squared, was taken as an indicator of returns that came out of selection of securities within the asset class.
By doing a series of such style analyses for different months, it was found that XYZ Fund progressively increased its emphasis on large growth stocks and reduced its exposure to small capitalization stocks during the 1 980s. This is not surprising, as the fund grew to approximately $14 billion by the end of the period, making substantial investment in very small stocks increasingly difficult. The change in style over time is evident from following Figure..
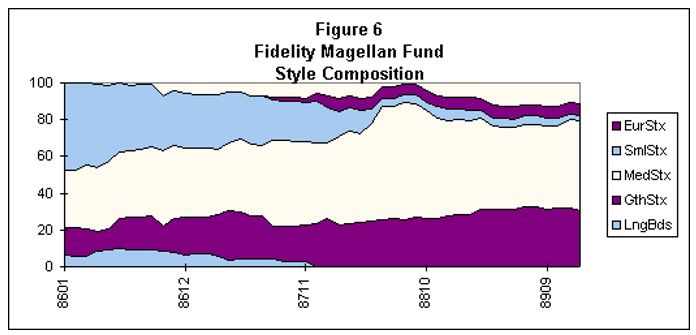
[Fidelity Magellan Fund Style Composition]
The difference in returns between the scheme and the benchmark ( S&P 500) was cumulated each month from January 1986 through December 1989. This comparison is shown below:
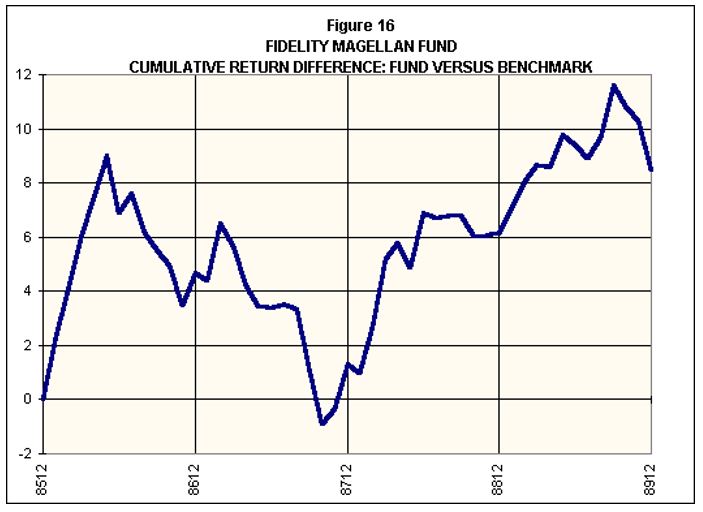
[Fidelity Magellan Fund-Fund vs Benchmark]
XYZ Fund provided a positive but statistically insignificant outperformance when compared with the S&P500 over the period. Such a comparison masked XYZ’s truly outstanding selection performance.
In order to capture the selection performance, William Sharpe tweaked the calculations a bit. He found that the fund outperformed its style benchmarks by a cumulative amount of over 25%, as seen in Figure as below :
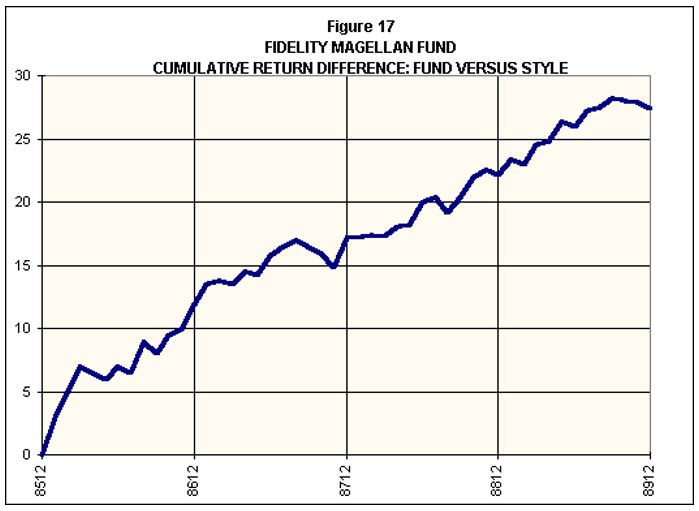
[Fidelity Magellan Fund-Fund vs Style]
Thus, by separating the style and selection returns, style analysis provides excellent insights into a fund’s performance. ‘Performance Attribution’ gets into some alternate approaches to disaggregating returns into their underlying strategies. |


 @ Rs.700")

 @ Rs.700")
 @ Rs.600")
 @ Rs.550")